Global Sub-Daily Rainfall (GSDR)#
Description#
Extreme short-duration rainfall can cause devastating flooding that puts lives, infrastructure, and natural ecosystems at risk. It is therefore essential to understand how this type of extreme rainfall will change in a warmer world. A significant barrier to answering this question is the lack of sub-daily rainfall data available at the global scale. To this end, a global sub-daily rainfall dataset based on gauged observations has been collated. The dataset is highly variable in its spatial coverage, record length, completeness and, in its raw form, quality. This presents significant difficulties for many types of analyses. The dataset currently comprises 23 687 gauges with an average record length of 13 years. Apart from a few exceptions, the earliest records begin in the 1950s. The Global Sub-Daily Rainfall Dataset (GSDR) has wide applications, including improving our understanding of the nature and drivers of sub-daily rainfall extremes, improving and validating of high-resolution climate models, and developing a high-resolution gridded sub-daily rainfall dataset of indices.
Source: Absract of Lewis et al. (2019).
Note
In SEASTERS, we included the stations from four countries: Japan, Malaysia, India and Australia.
Attention
The GSDR dataset is not publicly distributed! Before using this data for published work, please first contact the CNRM branch of SEASTERS – who we got this data from – to get the approval of the team behind the dataset. Also check this page’s How to cite section.
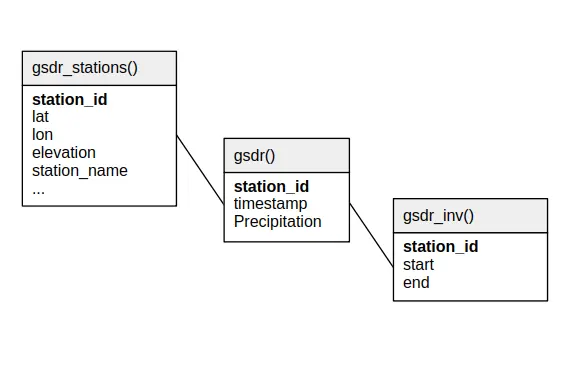
Relational schema#
Below is the relational schema of GSDR in SEASTERS.
The only variable in this dataset is Precipitation, stored in millimeters.
Station names and IDs#
Station IDs#
Station IDs are quite diverse across countries. In GSDR, they have been formatted as
<ISO_alpha-2>_<national_station_id>, where <ISO_alpha-2> refers to a 2 character
country code of the ISO 3166 standard.
For instance, IN_33 is the ID of a station located in India, and
MY_pahang_4023001 that of a station located in Malaysia.
Station names#
There’s nothing fancy about station names. Simply note that their source country is
indicated between parentheses, e.g., with IKEDA (Japan) for the JP_20441
Japanese station.
About quality checks#
This section is adpated from the supplementary of Moron et al. (2024). The “We” refers to the team behind the dataset.
Criteria of dubious records#
We consider three additional checks to remove dubious records or rain gauges ;
Hourly records >= 300 mm;
Very long sequences of zeros rainfall which could indicate spurious filling of missing data;
Long sequences of the same hourly amounts which could indicate spurious repetitions.
We considered first any hourly record >= 300 mm as dubious, since it is close to the official WMO world record of 305 mm recorded at Holt (Missouri, USA) on June 22, 1947 (source). We also checked if the surrounding stations within a radius of 50 km (if there are some available stations) receive significant hourly rainfall >= 10 mm.
The second criteria about the consecutive zeros may be a priori irrelevant for our main purpose, which is the analysis of wet spells, but any spurious sequence of zeros will bias any monthly or seasonal amounts, which are also analyzed.
The main theoretical issue related to the second and third criteria is the lack of any predefined and unique threshold to decide if a dry or a constant sequence is spurious or not. The second criteria depends clearly on the mean annual cycle and the length of the usual dry season. For example, 9 or 10 consecutive months without any rainfall is highly probable for central Australia or NW India, while it would be highly dubious for a rain gauge located either on the windward side of a tropical island, along the western Ghats in India, or close to the equator in Malaysia.
About the third criteria, we decided that any sequence of constant rainfall >= 1 mm lasting at least 6 consecutive hours is dubious.
We detail in the following each of the network.
India#
The Indian database includes 62 stations having at least 8760 x 5 hourly records and the highest hourly rainfall is 150 mm. The longest sequence of zeros rainfall lasts 7700 hours and occurs at Jaisalmer, which is the driest rain gauge (mean annual amount = 225 mm) and thus appears reasonable. There are two occurrences of 7 and 11 consecutive hours with a constant amount, which are replaced by missing entries.
Australia#
The Australian database includes 531 stations having at least 8760 x 5 hourly records. A single station has hourly records >= 300 mm, and the three records are consecutive, which is impossible. So, these records are replaced by missing entries. 6 stations have at least one year without any rainfall (maximum is 480 days), but these stations receive less than 50 mm of annual rainfall in mean. 13 stations have at least ¾ of a year fully dry. Again, their mean annual rainfall is <= 100 mm, so compatible with such long dry sequences. 0.0015 % of the available hourly data are included in wet spells with a constant value and lasting at least 6 hours and the corresponding hours have been replaced by missing entries. The highest hourly rainfall is 272 mm.
Malaysia#
The Malaysian database is the most problematic. There are 200 stations with at least 8760 x 5 available hours. There are 5155 hourly records >= 300 mm but they are heavily concentrated in 2 rain gauges (with respectively 4832 and 283 cases) with a repetition of the same (very high) values. Both stations are removed from the database. In the remaining 11 stations containing between 1 and 10 hourly records >= 300 mm, we checked the hourly amounts recorded at stations within a radius of 50 km. Only 4 cases (out of 40) have at least one surrounding station receiving >= 10 mm (maximum = 62 mm) during a >= 300 mm event. We choose a conservative approach to replace all these records >= 300 mm by missing entries. Only 25 hourly records are >= 200 mm after this first cleaning. 11.35 % of available hourly records are included in an absolute dry spell lasting at least 6 consecutive months – sometimes 10 consecutive years are dry–, which is highly spurious in a wet country as Malaysia, especially with two wet seasons even if they are not equally abundant across the country. After having replaced the corresponding values by missing entries, one station does not fill anymore the criteria of the 8760 x 5 available entries and is discarded. 0.25 % of the available hourly data are included in wet spells with a constant value and lasting at least 6 hours and the corresponding hours have been replaced by missing entries.
Japan#
The Japanese network contains 37 stations with a maximum hourly record of 152 mm and a longest dry spell of 49 days. Only 0.0076 % of the available hourly records are included in a wet spell with constant values and lasting at least 6 hours and are replaced with missing entries.
How to cite?#
The documentation does not indicate any version, doi or dataset-type citation. We suggest simply citing Lewis et al. (2019).
Attention
The GSDR dataset is not publicly distributed! Before using this data for published work, please first contact the CNRM branch of SEASTERS – who we got this data from – to get the approval of the team behind the dataset.
References#
Renaud Barbero, John T. Abatzoglou, and Hayley J. Fowler. Contribution of large-scale midlatitude disturbances to hourly precipitation extremes in the United States. Climate Dynamics, 52(1):197–208, 2019. doi:10.1007/s00382-018-4123-5.
Renaud Barbero, Hayley J. Fowler, Stephen Blenkinsop, Seth Westra, Vincent Moron, Elizabeth Lewis, Steven Chan, Geert Lenderink, Elizabeth Kendon, Selma Guerreiro, Xiao-Feng Li, Roberto Villalobos, Haider Ali, and Vimal Mishra. A synthesis of hourly and daily precipitation extremes in different climatic regions. Weather and Climate Extremes, 26:100219, 2019. doi:10.1016/j.wace.2019.100219.
Stephen Blenkinsop, Hayley J. Fowler, Renaud Barbero, Steven C. Chan, Selma B. Guerreiro, Elizabeth Kendon, Geert Lenderink, Elizabeth Lewis, Xiao-Feng Li, Seth Westra, Lisa Alexander, Richard P. Allan, Peter Berg, Robert J. H. Dunn, Marie Ekström, Jason P. Evans, Greg Holland, Richard Jones, Erik Kjellström, Albert Klein-Tank, Dennis Lettenmaier, Vimal Mishra, Andreas F. Prein, Justin Sheffield, and Mari R. Tye. The INTENSE project: using observations and models to understand the past, present and future of sub-daily rainfall extremes. In Advances in Science and Research, volume 15, 117–126. Copernicus GmbH, 2018. doi:10.5194/asr-15-117-2018.
Selma B. Guerreiro, Hayley J. Fowler, Renaud Barbero, Seth Westra, Geert Lenderink, Stephen Blenkinsop, Elizabeth Lewis, and Xiao-Feng Li. Detection of continental-scale intensification of hourly rainfall extremes. Nature Climate Change, 8(9):803–807, 2018. doi:10.1038/s41558-018-0245-3.
Elizabeth Lewis, Hayley Fowler, Lisa Alexander, Robert Dunn, Fergus McClean, Renaud Barbero, Selma Guerreiro, Xiao-Feng Li, and Stephen Blenkinsop. GSDR: A Global Sub-Daily Rainfall Dataset. Journal of Climate, 32(15):4715–4729, 2019. doi:10.1175/JCLI-D-18-0143.1.
Xiao-Feng Li, Stephen Blenkinsop, Renaud Barbero, Jingjing Yu, Elizabeth Lewis, Geert Lenderink, Selma Guerreiro, Steven Chan, Yafei Li, Haider Ali, Roberto Villalobos Herrera, Elizabeth Kendon, and Hayley J. Fowler. Global distribution of the intensity and frequency of hourly precipitation and their responses to ENSO. Climate Dynamics, 54(11):4823–4839, 2020. doi:10.1007/s00382-020-05258-7.
Yafei Li, Hayley J. Fowler, Daniel Argüeso, Stephen Blenkinsop, Jason P. Evans, Geert Lenderink, Xiaodong Yan, Selma B. Guerreiro, Elizabeth Lewis, and Xiao-Feng Li. Strong Intensification of Hourly Rainfall Extremes by Urbanization. Geophysical Research Letters, 47(14):e2020GL088758, 2020. doi:10.1029/2020GL088758.
Vincent Moron, Erwan Cornillault, Haider Ali, Hayley Fowler, and Andrew Robertson. A climatology of local hourly wet spells across the Tropics. Research Square, 2024. Preprint. doi:10.21203/rs.3.rs-4582986/v1.